Menu
By Danell J. Haines, PhD
The National Home Infusion Foundation’s (NHIF) Status at Discharge Benchmarking initiative is based on the need for research that evaluates the safety of home infusion services and aims to understand why patients discontinue their home infusion service. The goals of the program include obtaining data on the percentage of patients who complete their home infusion medication therapy and calculating the incidence of adverse drug reactions and unplanned hospitalizations that caused discontinuation of therapy. This initiative also collected descriptive data about home infusion services, such as patient demographics and the types of catheters utilized.
The following benchmarking metrics were noted as most relevant for infusion providers in measuring performance related to patient status at discharge:
A “therapy completed” benchmark is not used for all therapy types. This was decided because some therapies are used for chronic conditions and are not ordered with a definitive end date or specified number of doses to be administered. Due to low sample sizes, the “therapy completed” metric was not reported quarterly for the anti-neoplastic chemotherapy and others (non-biologic). With the aggregation of the 2022 quarterly data, the sample sizes are large enough to compare the 2021 outcomes with the newly established 2022 benchmarks.
Providers who contributed 2022 quarterly data for this project received a comprehensive project report which included the results of aggregate status at discharge data analyzed by therapy type. Quarterly, participating providers who submitted at least 15 patient cases were given a comprehensive individualized report. Through this data, the provider sees a comparison of their patient outcomes to other organizations participating in the program, which is a first step to quality improvement. Patient outcomes data allows the provider to make decisions about how to best care for patients and predict the patients who might benefit most from a particular intervention. Likewise, the data helps the provider identify improvements after an intervention is given. In other words, the data fosters improved patient-centered care and clinical decision-making.
Participants in the Status at Discharge Benchmarking program agree to report data according to standard discharge variables and their definitions. These definitions are published on the NHIF website and in the Benchmarking Guide given to each location contributing data to the benchmark. Participants in the program can still collect more detailed reasons for discharge if they desire, however the data is consolidated into the categories below for benchmarking purposes.
During 2022, data was submitted from 6,842 patient cases and included patients who were discharged from a home infusion service. Due to the sample size and representativeness of the therapy types, the data set is considered representative of the home infusion industry. The mean patient age was 59.30 years (SD=17.99), and ages ranged from 1 to 100 years. Males and females represented 58.69% and 41.31% of the sample, respectively. Gender data was newly collected in 2022 and allows for a comparison of results between genders. The largest percentage of patients are in the 65+ age group (43.35%), which is of interest given the lack of a comprehensive Medicare benefit for home infusion therapy services.
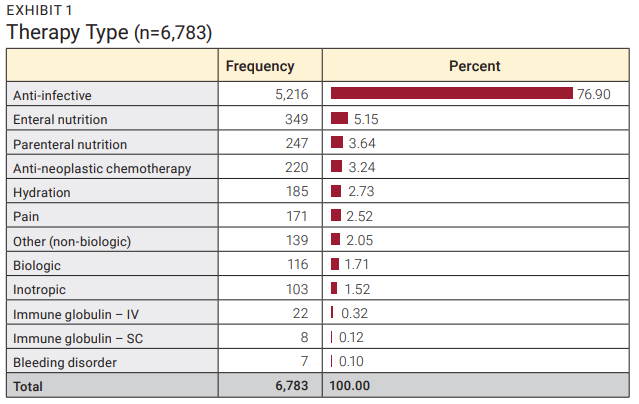
As expected, most (76.90%) of the discharged patients received an anti-infective therapy followed by enteral nutrition (5.15%), and parenteral nutrition (3.64%). Each of the remaining therapy types comprised less than 4% of the overall total as shown in Exhibit 1.
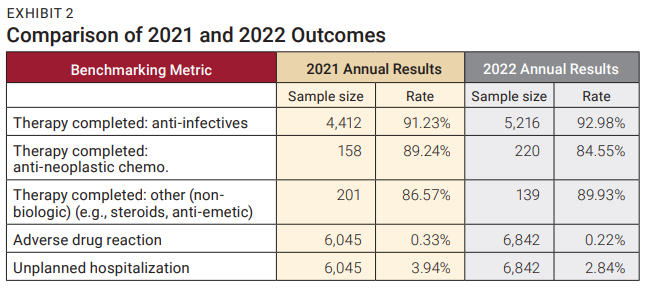
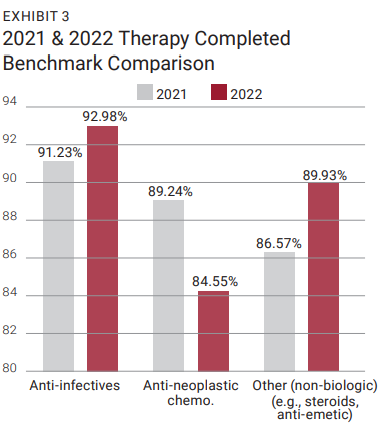
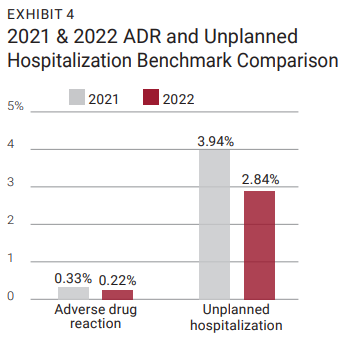
The primary goal of the Status at Discharge Benchmarking program is to establish metrics that providers can use to compare patient outcomes. While program participants receive quarterly reports comparing their location performance against the aggregated quarterly data, the result of the annual analysis is more valid and generalizable to the home infusion industry. As noted in Exhibit 2, the reported therapy completed rates indicate that patients receiving anti-infective, chemotherapy, and “other” therapies have high success rates associated with the home infusion industry. The 2022 anti-infective therapy completed rate was the highest of all therapy types (92.98%) followed by other (non-biologics) (89.93%). When these rates are compared to the 2021 benchmarks, therapy completed rates improved for the anti-infective and other (non-biologics) therapy categories (Exhibit 3). When the 2022 quarterly patient therapy type data is aggregated (n=6,842), the rate of discontinuation due to an adverse drug reaction (ADR) is 0.22% and unplanned hospitalization is 2.84%. Both rates were lower when compared to the 2021 annual outcomes, as shown in Exhibit 4. Providers who participated in this program can use the analysis in Exhibit 2 for comparison purposes since their data was collected using the standard definitions for patient discharge.
Home infusion provider locations now have updated status at discharge external references (metrics) that are based on the 2022 aggregate data. Participants in the program can compare their 2023 quarterly results to the national annual benchmarks, identifying strengths and weaknesses which can be internally noted and acted upon. The cross-tabulation analysis among quarterly data variables, that participating providers receive in their report, help providers target trends among specific populations (e.g., pediatric patients on PN therapy) that are otherwise obscured or difficult to analyze independently. While the data does not provide a comprehensive view of how often ADRs or unplanned hospitalizations occur in home infusion, it does illustrate that these events rarely result in discontinuation of services. This data offers evidence to counter speculation by skeptics of home infusion that patients are at risk of serious ADRs if treatments are given at home. In reality, serious ADRs that result in discontinuation of therapy are extremely rare events.
It should be noted that when individual providers use the established ADR and unplanned hospitalizations benchmarks for comparison purposes, their data might be skewed by a large difference in therapy type breakdown. For example, some therapy types might have a higher rate of ADRs and/ or hospitalizations. If a provider location has a disproportionate number of patients that are administered a high ADR therapy type, their overall ADR rate might be higher than the benchmark. For this reason, therapy type data, used to determine the overall ADR and hospitalization rate, is provided in the Status at Discharge report that participating providers receive.
Most provider locations collect data pertaining to ADRs, unplanned hospitalizations, and therapy completed as the reasons for discharge from home infusion; however, only providers who have adopted the NHIF standard definitions can compare their outcomes to the industry standards. Participation in benchmarking maximizes the value of this data and enables providers to target their quality improvement efforts on specific populations. NHIF needs more companies to participate in the benchmarking program to allow for additional analysis for therapy categories with smaller sample sizes.
If your provider location has not submitted data to this benchmarking initiative, please consider enrolling and submitting data. This project is also incumbent on providers who are enrolled to continue to submit their data each quarter. For more information on how to participate in NHIF’s benchmarking program, please visit the NHIF website. Here you will find all the information for the benchmarking program which includes patient satisfaction, status at discharge, and 30-day hospital readmission.
To discuss any of the NHIF programs, feel free to send an email to nhifdata@nhia.org.
Danell J. Haines, PhD is a research consultant who works closely with NHIA and NHIF.
The NHIF Benchmarking Program is generously supported by Brightree.
| Cookie | Duration | Description |
|---|---|---|
| cookielawinfo-checbox-analytics | 11 months | This cookie is set by GDPR Cookie Consent plugin. The cookie is used to store the user consent for the cookies in the category "Analytics". |
| cookielawinfo-checbox-functional | 11 months | The cookie is set by GDPR cookie consent to record the user consent for the cookies in the category "Functional". |
| cookielawinfo-checbox-others | 11 months | This cookie is set by GDPR Cookie Consent plugin. The cookie is used to store the user consent for the cookies in the category "Other. |
| cookielawinfo-checkbox-necessary | 11 months | This cookie is set by GDPR Cookie Consent plugin. The cookies is used to store the user consent for the cookies in the category "Necessary". |
| cookielawinfo-checkbox-performance | 11 months | This cookie is set by GDPR Cookie Consent plugin. The cookie is used to store the user consent for the cookies in the category "Performance". |
| viewed_cookie_policy | 11 months | The cookie is set by the GDPR Cookie Consent plugin and is used to store whether or not user has consented to the use of cookies. It does not store any personal data. |