Volume 2, Issue 3 > Infusion Journal > Development of Productivity Standards for Ambulatory Infusion Suite Nurses Within a Multi-Entity Health System

Development of Productivity Standards for Ambulatory Infusion Suite Nurses Within a Multi-Entity Health System

Jennifer Zhao, Johns Hopkins Care at Home
Brian Sherman, RN, Johns Hopkins Care at Home
Ashley McCracken, PharmD, MBA, Johns Hopkins Care at Home
Stephanie Watkins, RN, Johns Hopkins Care at Home
Kristopher Rusinko, PharmD, PhD, MBA, MEd, MS, Johns Hopkins Care at Home

Abstract

Introduction: A productivity metric that infusion sites measure to gauge operations is chair capacity, which is a direct reflection of physical chair utilization based on the inputs of total time patients occupy chairs and total time the chair is available (i.e., hours of operation multiplied by chair count). Although a convenient metric, it does not capture all relevant information, and there is a need to identify standard metrics that account for infusion nurse workload. Minimal literature currently exists that describes specific methods for obtaining more accurate clinician-focused capacity metrics that could better track productivity and staffing needs for successful operations. The purpose of this project is to identify metrics that will account for clinician-focused capacity and use them to create an operational tool that ambulatory infusion suites (AISs) can utilize to relay productivity and business standards.

Methods: Two time studies were conducted across 3 AIS locations within our organization: (1) an inperson time study of 7 nurses observing of all performed tasks (including both clinical and non-clinical care) over approximately 52 hours; and (2) an electronic time study looking at electronic health record (EHR) appointment reports (infusion therapy, appointment length, patient check-in time, and discharge time) over a 1-month period (n=407). Data from the 2 time studies were used to develop and validate metrics and metric parameters for an infusion nurse productivity scorecard.

Results: From the in-person time study, 50 distinct tasks were identified and grouped into categories (Operations, Direct Patient Care, Indirect Patient Care, Medications, Documentation, Communications, and Other). Assuming an 8.5-hour workday, nurses were estimated to spend similar amounts of time in Communications (76.5 min), Direct Patient Care (81.6 min), Documentation (86.7 min), and Indirect Patient Care (96.9 min). Amongst individual tasks, patient chart checks (40.8 min), and appointment scheduling (35.7 min) occupied the most time. Analysis of patient encounters from EHR informed proposals to shorten, extend, or make no changes to appointment lengths for different treatments. The productivity scorecard comprised specific tasks, allotted points, and goal number of points for nurses to achieve daily. Testing of the scorecard via retrospective grading on 5 full-day time studies determined 15 points’ worth of tasks a day for a nurse to be considered “productive.”

Implications/Conclusions: The time studies highlighted trends and potential areas of improvement in AIS nurse workflow, scheduling, and resource needs. The creation of the operational scorecard tool will allow AIS management to better evaluate productivity during business performance reviews. Adoption across all infusion centers within our organization would be ideal; however, it is unclear if operational differences at non-studied AIS locations may affect standards and should be tested prior to universal adoption. Additionally, this project specifically focused on infusion nurses, and further research is needed to identify similar items for other AIS personnel (e.g., pharmacists, medical assistants). Overall, capacity within AIS should be measured by both physical chair utilization and clinician-focused consideration. Development of a tool that accounts for personnel capacity will better inform operational limits and opportunities.

Keywords: ambulatory infusion suite, time study, nurse productivity

Introduction

Ambulatory infusion suites of the home infusion therapy provider, otherwise known as ambulatory infusion suites (AISs), have become emergent health care facilities. As alternative sites of care to hospital settings, AIS sites facilitate logistics for patients to receive clinical care from infusion personnel—often infusion nurses and pharmacists—pursuant to physician orders for administration of infusion or specialty drugs.1 Since the 1980s, the home infusion and alternate site infusion industry has seen tremendous growth. In 2019, home infusion and alternate site providers cared for more than 3.2 million patients in the United States, which represented a three-fold increase since 2008.2 The safety, effectiveness, and cost savings associated with these alternative sites make them highly attractive options for patients with both acute and chronic conditions that cannot be effectively treated with oral medications alone.

With more patients choosing to receive care in AIS sites, these sites strive to provide services to as many patients as possible. To meet this goal, it is beneficial for AIS sites to capture metrics to trend patient volume, which can in turn help gauge the productivity of AIS site operations. Metrics can also potentially inform business decisions to expand AIS site capacity, such as whether to add more infusion chairs or even clinical resources. In addition, these metrics can be used as a surrogate for AIS site management to track the productivity of infusion personnel and monitor staffing needs. 

The most common metric used to measure productivity of AIS sites is chair capacity. Chair capacity is a direct reflection of physical infusion chair utilization. It is based on 2 inputs: the total time patients occupy infusion chairs and the total time the chairs are available. Calculating the total available infusion chair time can be found by multiplying the AIS site’s hours of operation by the total chair count (Figure 1).3 

For example, an AIS site that is open from 9:00 AM to 5:00 PM and has 10 infusion chairs would have a total of 80 available chair hours per day. If 9 patients showed up 1 day, and each needed a 6-hour infusion (e.g., starting from taking premedications 30 minutes prior to starting infusion, running the infusion, and staying for an additional 30 minutes for observation), the total amount of patient-occupied chair time would be 54 hours that day. Utilizing the calculation in Figure 1, 54 hours of the possible 80 would be utilized and the day’s chair capacity would be 67.5%.

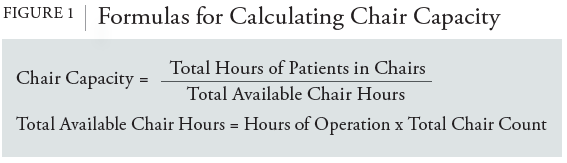
The simplicity of the theory behind chair capacity makes it an easy-to-use and easy-to-understand metric to show productivity. The total available chair-hours represent the theoretical maximum number of hours of infusions that the site can provide; if the site wished to offer more hours, it must increase the number of hours of its operations, add additional infusion chairs, or both. The optimal chair capacity that AIS sites strive to reach is as close to 100% as possible, to allow AIS sites to maximize the number of patients seen while minimizing vacancies between infusion appointments. However, it is generally not realistic to schedule patients such that when 1 patient arrives for an infusion, the person who had been occupying that specific chair will have just completed their appointment. According to the 2019 Infusion Center Volumes, Staffing, and Operations Survey, the median daily scheduled chair utilization rate was 80%, and the median actual chair utilization rate was 70%.4

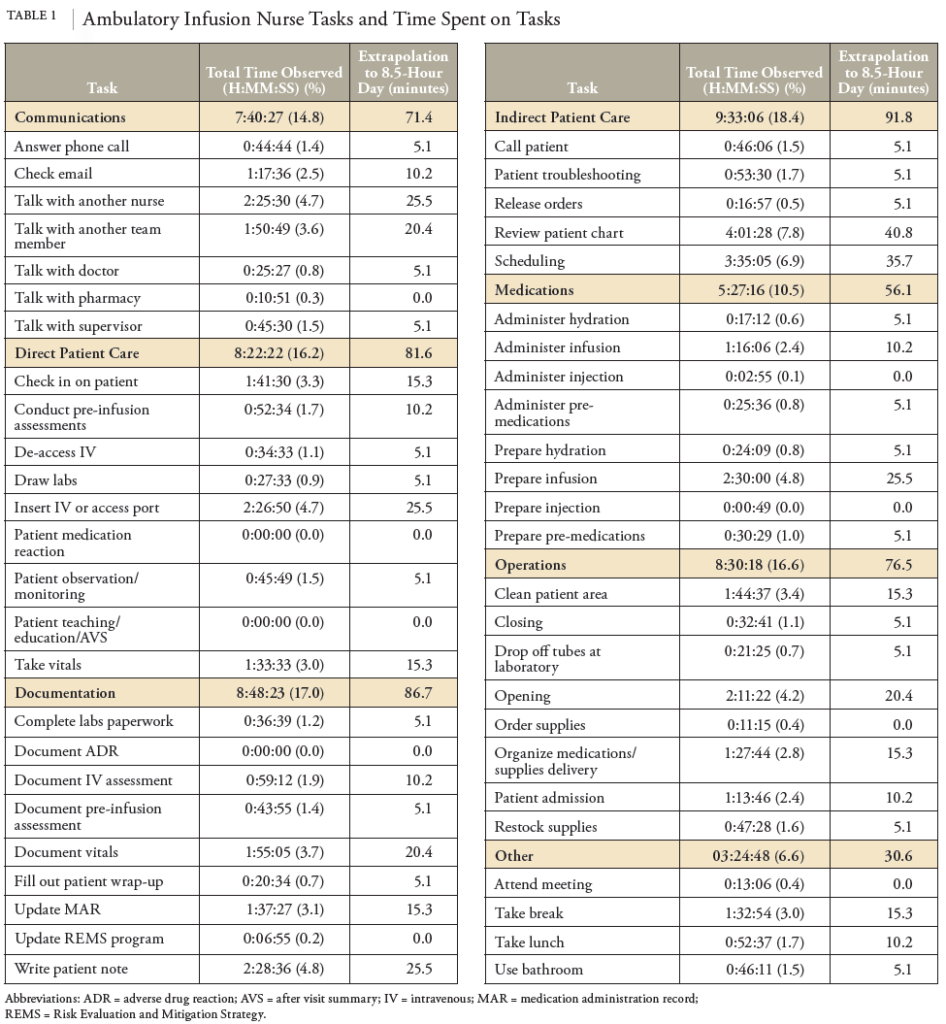
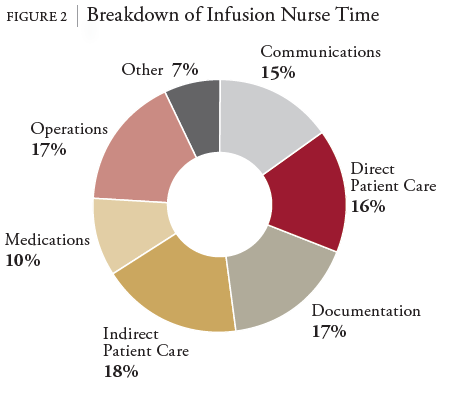
It is worth noting the drawbacks of chair capacity, even as it is the mainstay of AIS productivity measurement. First, chair capacity does not necessarily consider variability in the day. A full schedule may change because of appointment rescheduling, canceling, patient no-shows, or walk-ins. These changes may happen at any time and cannot easily be predicted. Although chair capacity would increase or decrease accordingly, it would not be able to provide an explanation on why the percentage was higher or lower than expected. Second, the sole number that chair occupancy presents can be misleading. The amount of time that a patient is sitting in an infusion chair may not necessarily equate to the amount of quality care they are receiving. Results of the 2014 National Hospital Oncology Benchmark for Infusion found that infusion chairs are utilized for active treatment only 18% of the total chair time available.5 Third, while it may seem that patients sit idly in infusion chairs for more than 80% of their time, it should be mentioned that infusion personnel, such as infusion nurses, are completing a multitude of tasks in the background. For example, infusion nurses are involved in communications, education, medication administration, and documentation, and they are often rapidly shifting between tasks or multitasking.6 Chair capacity gives no indication of this behind-the-scenes work. Thus, it is important to comprehend what is happening beyond the physical infusion chair.

We argue that chair capacity’s ability to provide deeper insight into AIS operations and productivity is limited. We propose the need to pivot away from chair capacity to a different kind of metric, which we call “clinicianfocused capacity.” There is a need for metrics that can measure productivity not only more comprehensively, but also with an actionable level of detail. Instead of focusing on physical chair utilization, the focus should be on the infusion personnel who are orchestrating patient care and treatment. We believe that clinicianfocused capacity, which would measure productivity based on the tasks that infusion personnel spend their time on each day, would better inform AIS management on productivity. Clinician-focused capacity would paint a bigger picture of daily operations, as well as provide information to analyze where improvements in AIS site workflow can be made.

Unfortunately, minimal literature describes specific methods on how to collect data to measure productivity of infusion staff, not to mention standard metrics related to clinician-focused capacity. Some literature exists on the optimization of patient flow in infusion centers—specifically oncology infusion centers.7,8 However, there is minimal published literature that focuses on the workflow of infusion personnel. Additionally, there is little to no published literature on the study of workflow in non-oncology infusion suites.

Because of this lack of available information, we decided to develop a study to build out the concept of clinician-focused capacity. The intent of this project was to first identify a standardized set of tasks that can account for clinician-focused capacity, and in turn create an operational tool that AIS sites can use to inform productivity and business standards. Our goal was to provide a framework for AIS sites to use and begin incorporating clinician-focused capacity into their productivity metrics.

We note that this study specifically focused on developing clinician-focused capacity metrics with respect to infusion nurses. However, this study can be expanded to study other infusion personnel (e.g., pharmacists, pharmacy technicians, medical assistants) in the future.

Methods

To meet our objective to develop clinician-focused capacity metrics focused on infusion nurses, we performed 2 sets of time utilization studies. Time utilization studies (also known as time-and-motion studies; herein referred to as “time studies”) are commonly performed in health care settings to attain detailed observations of workers to determine the time required to accomplish specific tasks. These observations are ultimately used to assess and optimize quality, efficiency, and costs in health care delivery.9

To assess infusion nurse workflow at the AIS sites at Johns Hopkins Home Care Group (herein referred to as “our organization”), we performed time studies at our 3 non-oncology, non-gastrointestinal AIS sites. Our rationale for starting with these 3 sites was because they were operated solely by infusion nurses; these sites would be the simplest to observe before expanding our studies to other infusion sites with other infusion personnel.

In-Person Time Study
An in-person time study was performed on the fulltime infusion nurses that staffed across our 3 selected non-hospital AIS sites. Before conducting the time studies, informal observing was first completed to identify distinct tasks that infusion nurses performed over the course of the day, including tasks related to clinical care and non-clinical care. All tasks were then compiled and standardized into a single list. This list was referenced during the formal observation (e.g., time study), so documentation of infusion nurse actions would be consistent across all formal observations.

An Excel spreadsheet was developed to record the specific task performed by the observed infusion nurse, as well as automatically capture the date and time (formatted as MM/DD/YY HH:MM:SS using an Excel macro) when the action started and when it ended. This information was used to calculate the duration of time spent on each task performed. The lead author conducted time studies on all the fulltime infusion nurses. The data were then aggregated to calculate the total amount of time spent on each distinct task across the entire observation period. The information was then scaled to extrapolate how much time it would be expected to spend on each task in 1 business day (e.g., 8.5 hours).

Electronic Time Study
An electronic time study was performed to measure the duration of time of historical infusion appointments. The same 3 AIS sites that were studied as part of the in-person time study were also selected for the electronic time study. Reports of completed patient appointments over the course of 1 month (May 2022) at the 3 sites were generated from our electronic health record (EHR) system provider (Epic). The following information was extracted from the reports: type of infusion therapy, duration of scheduled appointment length, patient check-in time, and patient discharge time. The latter 2 parameters were used to calculate the actual duration of appointment length for comparison against the originally scheduled length. This information was used to determine the optimal length of appointments for different infusion therapies.

Development of Infusion Nurse Productivity Scorecard
Results from both the in-person and electronic time studies, as well as input contributed by infusion nurse staff, were used to develop an infusion nurse productivity scorecard.

results

Identification of Distinct Infusion Nurse Tasks
From the informal observation, a total of 50 distinct tasks performed by infusion nurses were identified (Table 1). For the formal observation (i.e., the inperson time study), a total of 7 full-time infusion nurses were observed across 3 AIS sites. The total observation period was approximately 52 hours (51 hours, 46 minutes, and 40 seconds). The amount of time that infusion nurses were observed performing each of the 50 tasks is detailed in Table 1. Additionally, Table 1 displays the amount of time expected to be spent on each task during a single workday (e.g., 8.5 hours), which was calculated in proportion to the total observation time. Amongst the list of 50 tasks, patient chart checks and appointment scheduling occupied the most time (40.8 min and 35.7 min, respectively, in an 8.5-hour workday).

For ease of analysis, the 50 tasks were grouped into larger categories: Operations, Direct Patient Care, Indirect Patient Care, Medications, Documentation, Communications, and Other. A breakdown of how much time nurses were observed to spend on each category is provided in Figure 2. Assuming an 8.5- hour workday, nurses were estimated to spend roughly similar amounts of time in Communications (76.5 min), Direct Patient Care (81.6 min), Documentation (86.7 min), and Indirect Patient Care (96.9 min).

Optimization of Patient Appointment Lengths
A total of 407 patient appointments across 34 types of infusion or injectable therapies, offered at the 3 AIS sites, were analyzed (Table 2). Upon comparison of the scheduled appointment length to the actual appointment length (e.g., time from patient check-in to patient discharge), it was noted whether the average actual duration most frequently matched, was longer than or shorter than the scheduled duration for each therapy. If the averaged actual duration of therapy was longer or shorter than the scheduled duration for a specific therapy, then changes were proposed to increase or decrease the scheduled duration, respectively. Proposed schedule lengths were rounded up to the next half-hour interval. The exception was if the next half-hour interval was less than 10 minutes from the average; an additional half-hour interval to the proposed appointment duration was added.

Development of Infusion Nurse Productivity Scorecard
Data from the in-person and electronic time studies were used to develop and validate metrics and metric parameters for the infusion nurse productivity scorecard (Table 3). The productivity scorecard comprised specific infusion therapies, ancillary tasks, allotted points to each therapy or ancillary task, and goal number of points for infusion nurses to achieve daily. Testing of the scorecard via retrospective grading of the time studies using the scorecard determined 15 points as the daily goal for a nurse to be considered “productive.”

discussion

In-Person Time Study
The in-person time study demonstrated not only the great number of tasks that infusion nurses performed throughout the day, but also the variety in tasks performed. It is interesting to note that nurses spent roughly equal percentages of time in all categories (except for tasks in the Other category), as opposed to predominantly spending their time in 1 or 2 categories (Figure 2). Additionally, it is interesting to note that the 2 categories in which nurses spent the most time (Indirect Patient Care and Documentation) were not categories that involved direct interaction with patients. It was helpful for the in-person time study to paint a more complete, and complex, picture of what was being done to care for patients during infusion appointments, which was a picture that chair capacity did not necessarily depict. 

It is worth noting that nurses were frequently found multitasking during observation. If a nurse was observed to be performing 2 tasks at the same time, the observed “primary action” (i.e., task perceived to be started first) was documented and time logged, with a note stating what the secondary action was. The in-person time study strived to accurately document when each task was started and stopped, even if an infusion nurse rapidly switched between 2 tasks. However, the time study results did not necessarily capture the mental load involved when infusion nurses balanced multiple patients and associated responsibilities all at the same time. Thus, it is worth considering the larger implications of multitasking on productivity, patient safety, and infusion nurse mental and emotional capacity.

Another interesting finding was the relatively smaller amount of time observed that nurses spent taking breaks. At our organization, full-time employees are expected to take a 30-minute lunch and may take two 15-minute breaks with the expectation that they would not be completed work-related duties. The total 60 minutes account for about 12% of a full workday. However, infusion nurses were observed to spend only 7% of their time in the day taking breaks. All but 1 nurse was observed not to take a formal lunch break. When asked why they did not step away for lunch, nurses stated they preferred to keep an eye on patients while eating in case they needed anything. While the nurses’ commitment to their patients is commendable, this raises the question of how nurses can balance their commitment while also caring for themselves to prevent burnout.

The in-person time study was highly insightful, but it does present some limitations. One limitation was that only 7 infusion nurses were observed. Additionally, not all nurses were observed for an entire workday (e.g., 8.5 hours); some were observed for a full day, and others were observed for a half day. The results of the time study may present differently if more nurses were observed, or if all 7 nurses were observed for a full day each, or both. However, it is also possible that these factors may not affect the results since it is generally assumed that all nurses perform to similar degrees in terms of speed and skill.

Electronic Time Study
The intent of the electronic time study was to gain additional insight on how infusion nurses’ time could be optimized. Historically, scheduling infusion appointments had been based on how long the infusion would be expected to take, with an additional 30 minutes added if the patient needed premeds before the infusion, as well as a 30-minute “buffer time” in between patient appointments. It was not necessarily expected that there would be many, if any, differences between the scheduled and actual appointment lengths when analyzing data from the electronic time study. However, it was interesting to note the differences that came up.

First, it was noted that a specific therapy may have been scheduled for a certain amount of time for 1 patient, but the same therapy was scheduled for a different amount of time for another patient, even if they had the same regimen. It was not explored in depth why these scheduled durations differed (e.g., patient-specific request to schedule a shorter infusion because they did not need an additional half hour for premeds). A contributing factor may be human-errorrelated drift away from standardization of scheduling patients for specific therapies. There may be a need to periodically audit appointment lengths to ensure that scheduling is streamlined and consistent. Additionally, following a standard operating procedure (e.g., clear indication of patient needed premeds; patient-specific infusion rates and durations) may help standardize those efforts.

Second, of the 34 infusion and injection therapies analyzed in the electronic time study, about one-third of the therapies presented differences between the scheduled and actual appointment duration large enough to warrant a proposed change in therapy duration. Specifically, it was proposed to increase the appointment length for 10 therapies and decrease the length for 3 therapies. There are several possible explanations for why several therapies may require a longer-than-expected appointment length. One may be due to the nature of the reconstitution and dilution process of certain therapies, especially those that take considerable time to dissolve into solution, must not be shaken, or require a separate filtration process. Another may be due to the need to slow down infusion rates if a patient experiences any adverse effect (even mild ones), such as flushing of the face, nausea, or tickling in the back of the throat. Great caution is taken in AIS sites to prevent a full-blown anaphylactic reaction, especially since adverse drug reactions (ADRs) can happen at any appointment at any time, even if it is a maintenance dose. A third possible explanation is that if infusion nurses are handling several patients at once, their multitasking may be slowing down their productivity, especially if a nurse is caring for several patients with complex therapies at the same time and several patients require tending to at similar time intervals. On the contrary, there are possible explanations for why some therapies need less time than expected. For example, perhaps the initial precaution to embed more time in case of patient ADRs was too great, especially if there was a lack of real-world patient data that said otherwise. Now that there is information that supports reducing infusion therapy length, perhaps anxieties surrounding infusion-related reactions for specific therapies can be eased.

Overall, the electronic time study demonstrated that the actual practice of preparing and administering infusion therapies does not always align with theoretical expectations. However, it is worth noting the limitations of the electronic time study. The electronic time study was only performed for infusion appointments completed over the course of 1 month. It is possible that a larger sample size of completed appointments may call for different suggestions on how long to schedule appointments for specific therapies. In addition, the electronic time study only investigated 34 types of infusion or injectable therapies as listed in Table 2. It would be interesting to compare the expected and actual durations of therapy of other medications that were not studied. It should also be noted that only completed infusion appointments were included in the electronic time study; cancelled, rescheduled, or incomplete appointments (e.g., patient left against medical advice) were not included. It would be interesting to investigate these outliers in connection to the type of therapy to see if any possible explanations could be drawn.

Infusion Nurse Productivity Scorecard
Both the in-person and electronic time studies provided a wealth of information on how infusion nurses spend their time at AIS sites. The challenge was to figure out how to synthesize the information into a tool that would reflect clinician-focused capacity. The intent of the productivity scorecard was to be comprehensive to reflect the breadth of work that infusion nurses perform yet remain operable so it would not be cumbersome to use. It is worth pointing out that the scorecard in Table 3 both parallels the traditional concept of chair capacity and expands into the idea of clinician-focused capacity. The top section that lists the type of therapy and respective proposed scheduling length (deducted from the electronic time study) and points per appointment parallels the concept of chair capacity. Longer infusions—which would imply longer times of patients occupying infusion chairs—result in more points. According to this productivity scorecard, 1 point is equal to 1 hour of chair time. The ancillary tasks were synthesized from the in-person time study in discussion with infusion nurse staff. Points upon completion of the ancillary tasks were awarded based on the magnitude of impact the tasks had on AIS operations and patient care.

After the infusion nurse productivity scorecard was developed, the scorecard metrics and goal number of points were validated by retrospectively applying the scorecard on the in-person time studies and scoring the 7 full-time infusion nurses who were observed. Results from these scores were used to adjust the scorecard metrics and points so it could become a more accurate tool for future use.

This infusion nurse productivity scorecard based on the principles of clinician-focused capacity has wide-ranging implications. The purpose of having these ancillary tasks listed in their own section was to recognize that not every infusion appointment is the same. Some appointments may be more complex than others. An extreme example would be an anaphylactic reaction that may require several unanticipated hours of care provided by the infusion nurse that would otherwise be spent tending to other patients. However, we recognized that an infusion nurse should be rewarded for handling this unexpected situation, as opposed to being potentially penalized for meeting lower chair capacity requirements. The list of ancillary tasks also strived to account for the day-to-day variability in AIS site operations. For example, if an infusion nurse was somehow scheduled to see fewer patients than usual for a certain day, the nurse can remain productive by taking on additional ancillary tasks and assisting other nurses. Infusion nurses should not be put at a disadvantage for scheduling factors outside of their control. By focusing on what infusion nurses spend their time doing as opposed to only focusing on physical chair utilization, infusion nurses can be recognized for both the work they are assigned to do and what they do when going above and beyond their individually assigned duties.

We recognize this scorecard also comes with some limitations. Notably, not every AIS site across different organizations may operate in the same fashion. It should be noted that while 15 points was considered “productive” for AIS infusion nurses at our organization, that number may look different at another organization, or even at another site within our organization that was not part of this study. We wish to disclose that this scorecard does not intend to establish a one-size-fits-all model to measure productivity at all AIS sites. It can be customized to better fit the specific operations at a particular AIS site, since not every site may operate in the same fashion. Another limitation is the assumption that all infusion nurses operate at the same speed and have the same expertise in skill. While we believe there is a standard of excellence to which all infusion nurses should be held, scoring an infusion nurse with no prior experience in infusion therapies would be an unfair comparison to scoring an infusion nurse with several years of experience. The intent of this scorecard was to align with AIS site management’s general expectation of how an infusion nurse should perform, not necessarily be used as a tracker for onboarding new nurses.

Despite these limitations, we are hopeful that the infusion nurse scorecard can be implemented as a useful tool to measure AIS site productivity. We hope to pilot the rollout of the productivity scorecard in our organization’s studied AIS sites. Application of the scorecard in day-to-day practice can help with refining appointment lengths, points, and productivity goals. Additionally, the scorecard can be expanded to include additional therapies as AIS sites expand their formularies. In the long term, this productivity scorecard has potential for adoption across all AIS sites after further tuning for operational differences at non-studied sites. There is also potential to identify comprehensive productivity metrics for other AIS personnel, such as pharmacists and medical assistants, like the metrics used to measure productivity for infusion nurses in this study.

conclusion

The time studies performed in this research highlighted trends and potential areas of improvement in AIS nurse workflow, scheduling, and resources. The data and insights gathered from the time studies allowed for development of an operational scorecard that encompassed the spirit of clinician-focused capacity instead of chair capacity. The hope for the infusion nurse productivity scorecard is to help AIS management evaluate productivity more holistically during business performance reviews. Clinician-focused capacity has the potential to expand in scope to apply to other AIS site personnel and provide a more comprehensive picture of the all the work that infusion personnel put into providing high-quality care to patients at AIS sites.

References

1. National Home Infusion Association. About home and alternate site infusion. Accessed May 4, 2023. Available at: https://nhia.org/about-infusion-therapy/

2. National Home Infusion Foundation (2020). NHIF Infusion Industry Trends 2020. Published by the National Home Infusion Association.

3. LeanTaas. More than chair counts: using operational factors to maximize infusion center capacity. Updated June 27, 2022. Accessed May 4, 2023. Available at: https://leantaas.com/blog/maximum-infusion-center-capacity-more-than-chair-counts/

4. Advisory Board. Timely care at infusion centers—how do you compare?. Updated Mar 17, 2023. Accessed May 8, 2023. Available at: https://www.advisory.com/blog/2020/02/infusion-centers-timely-care

5. Guidi TU, Kloos E. How Does Your Infusion Center Measure Up? Oncology Issues. 2015;30(6):60-4. doi: https://10.1080/10463356.2015.11884071

6.Hidayat LK, Hsu DI, Quist R, Shriner KA, Wong-Beringer A. High-dose vancomycin therapy for methicillin-resistant staphylococcus aureus infections: efficacy and toxicity. Arch Intern Med. 2006;166(19):2138.

7. Sugalski JM, Kubal T, Mulkerin DL, Caires RL, Moore PJ, Fiorarancio Fahy R, et al. National Comprehensive Cancer Network Infusion Efficiency Workgroup Study: Optimizing Patient Flow in Infusion Centers. J Oncol Pract. 2019;15(5):e458-e66. Epub 20190409. doi: https://10.1200/JOP.18.00563. PubMed PMID: 30964732

8. Plourde CL, Varnado WT, Gleaton BJ, Das DG. Reducing Infusion Clinic Wait Times Using Quality Improvement. JCO Oncology Practice. 2020;16(8):e807-e13. doi: https://10.1200/JOP.19.00643

9. Lopetegui M, Yen P-Y, Lai A, Jeffries J, Embi P, Payne P. Time motion studies in healthcare: What are we talking about? Journal of Biomedical Informatics. 2014;49:292-9. doi: https://doi.org/10.1016/j. jbi.2014.02.017