Volume 2, Issue 3 > Infusion Journal > Cost Savings: Home Versus Inpatient Infusion Therapy, A Review of the Literature

Cost Savings: Home Versus Inpatient Infusion Therapy, A Review of the Literature

Danell Haines, PhD, Research Consultant, D.J. Haines Research Consulting

Abstract

Introduction: Home infusion is a site of care (SOC) option for patients requiring intravenous (IV) or subcutaneous (SC) medications for treatment of acute and chronic medical conditions. Patients and payors have become aware of the sizeable cost savings associated with home infusion when compared to other SOC. There is a need to gain an understanding of the amount of savings associated with home infusion when compared to other SOCs such as the hospital. The literature review objective is to provide a critical evaluation of the current evidence of the cost savings associated with home and outpatient infusion therapy when compared to inpatient therapy.

Methods: The literature search was conducted between July 1, 2023, and August 2, 2023, and focused on terms related to home infusion, home-based, homecare, outpatient or infusion followed by cost, cost comparison, cost savings, or SOC optimization. PubMed through the National Library of Medicine was searched. After reviewing the articles, it was determined that it is not feasible to compare U.S. health care cost results to other countries due to significant differences in health care systems, financial resources, and co-payment systems, thus studies conducted outside of the U.S. were excluded.

Results: Six articles met the review inclusion criteria. The first article was a cost analysis of a home infusion anti-infective program and showed that the savings per home infusion patient was $40,460 when compared to inpatient costs. Another article investigated the cost of home and inpatient anti-infective infusion and determined that the cost per day for home infusion was $122 while the cost for inpatient was $798. The third article calculated the cost difference of home infusion enzyme replacement with inpatient therapy and concluded a significant difference (p≤.0001) existed between the SOC costs. One study focused on developing a cost model using patient care information that included Medicare data. The model showed a cumulative 5-year savings of nearly $3 billion in 2023 health care dollars. The last article compared the home and inpatient infusion cost of inotropic therapy and concluded that the home infusion savings was $71,300 to $120,500 per patient.

Discussion: The reviewed studies demonstrate significant cost savings when the home is the SOC for infusion therapy, especially for IV antimicrobial treatment. This is significant as IV anti-infective therapies comprise nearly half of all treatments done at home today. One study provides evidence for savings associated with enzyme replacement; a therapy analogous to the growing number of specialty biologics being used today to manage chronic diseases. Despite evidence of cost savings Medicare has not developed a home infusion benefit comparable to what is available in the private sector.

Conclusions: The literature review provides evidence of consistent cost savings associated with home and outpatient infusion therapy when compared to the inpatient SOC for a range of infused drugs. The study with the most rigorous methodology involved a model that showed a 5-year Medicare savings of $3 billion in today’s dollars with the implementation of a home infusion anti-infective therapy Medicare benefit.

Keywords: Home Infusion, Site of Care, Cost, Medicare, Homecare

Introduction

Home infusion is a site of care (SOC) option for patients requiring intravenous (IV) or subcutaneous (SC) medications for treatment of acute and chronic medical conditions, ranging from bacterial infections to heart failure, nutrition support, cancer, and auto-immune diseases. Home infusion is well established, having been in place for more than 4 decades spurred primarily by commercial insurance plans that capitalize on the cost savings of administering IV and SC infused treatments at home rather than in facility-based settings. The increased number of infused therapies, improved access devices, patient preference for home-based care, coupled with a well-established commercial reimbursement pathway has prompted consistent growth of home infusion within the context of the health care market. In 2010, the National Home Infusion Association (NHIA) reported that infusion providers served 829,000 unique patients, whereas in 2019 this number grew to more than 3.2 million which represents a growth of 310%.1

The popularity of home infusion is due to many factors and includes the growing confidence that physicians have with the home infusion process, comparable clinical outcomes, and improved quality of life reported in the literature.2 Additionally, patients and payors have become aware of the sizeable cost savings associated with home infusion when compared to other SOC. This concept is often referred to as an SOC optimization strategy. With costs related to a growing class of infused specialty drugs continuing to increase, there is a need to gain an understanding of the savings associated with home infusion when compared to other SOCs such as the hospital where these drugs and biologics tend to be infused. In addition to research studies, many companies have published reports demonstrating cost-savings, as well as improved outcomes, associated with SOC optimization programs. For example, United Health Care and Cigna have touted the savings achieved through SOC programs, and Medicare aims to divert some therapies to the home by designating drugs as “usually self-administered”.3,4 To meet this need, this review summarizes the research on the cost savings associated with home and outpatient infusion when compared to the inpatient SOC.

The last known review of the literature on the inpatient-outpatient infusion cost comparison was reported in 2017, conducted in Brazil, and focused only on anti-infective therapy.5 In the U.S., the same type of review was reported in 1989 and concluded that all studies in the review showed cost savings in the outpatient SOC.6 There is a plethora of reported research in other countries on the cost differences of outpatient and inpatient infusion7-11, with the home and outpatient SOC showing significant savings.

The objective of this literature review is to provide critical evaluation of the current evidence of the cost savings associated with home and outpatient infusion therapy when compared to inpatient therapy. SOC optimization when applied to home infusion involves patients moving away from high-cost health facilities, such as hospitals, to lower-cost settings, such as home infusion. As stated by Tsai and Doherty, “Effectively, the success of population health management has hinged on SOC optimization in an effort to provide the highest quality care at the lowest cost SOC.”12 This review will evaluate published studies that examine whether home infusion as a SOC optimization strategy is associated with cost savings in the U.S., and whether implementing such a benefit for Medicare would be likely to generate cost savings for the government.

Methods

The literature search was conducted between July 1, 2023, and August 2, 2023, and focused on terms related to home infusion, home-based, homecare, outpatient or infusion followed by cost, cost comparison, cost savings, or SOC optimization. PubMed through the National Library of Medicine was searched. This search engine comprises more than 35 million citations for biomedical literature from MEDLINE, life science journals, and online books. This search produced 18 journal articles of which 14 included cost data from studies conducted outside of the U.S. After reviewing the articles, it was determined that it is not feasible to compare U.S. health care cost results to other countries due to significant differences in health care systems, financial resources, and co-payment systems, thus studies conducted outside of the U.S. became an exclusion criterion. The number of journal articles meeting the inclusion criteria was reduced to 4, thus reference lists from the original 18 articles were reviewed to determine if other U.S. home infusion cost comparison studies existed. Two additional reported studies were located and considered appropriate for the review.

Results

As shown in Table 1, six articles met the inclusion criteria for this review and differed in terms of methods used, types of costs, SOC, and patient populations of interest. Most of the articles use the term “outpatient” which is a broad term that includes SOCs that do not require a hospital admission while inpatient includes a hospital admission. The articles are discussed in the order presented in Table 1.

The first article is a cost analysis of a home infusion anti-infective program for patients with osteomyelitis and was conducted by Chamberlain, et al. using patients’ billing records and charts. The cost savings per home infusion patient was $40,460 when compared to inpatient costs.13 Dalovisio, et al., also investigated the cost of home and inpatient anti-infective infusion.14 A retrospective chart review compared home infusion cost to an inpatient theoretical cost. The aim of the study was to show the financial impact of a home infusion anti-infective program on a Medicare managed care program. It was determined that the cost per day for home infusion was $122 while the cost for inpatient was $798. The total cost of the 66 courses of anti-infective therapy, encompassing 1542 patient-days was $188,663. The estimated savings ranged from $646,000 to $871,000 when the home was the SOC.

Stewart et al. investigated the cost difference of home infusion enzyme replacement with inpatient therapy and concluded that there was a significant difference (p≤.0001) between the home and inpatient cost.15 Home infusion and inpatient mean cost per day was $225.10 and $586.50 respectively. Another anti-infective pharmacoeconomic analysis was conducted by Ruh, et al. using billing records.16 The study concluded that home infusion is an efficient and cost-effective method of treating patients who require long-term antimicrobial therapy. Furthermore, it was reported that the mean total cost savings for each home infusion patient was $81,559 when compared to inpatient cost.

Tice, et al. aimed to develop a cost model using patient care information that included Medicare data, to determine the 5-year savings associated with a home infusion anti-infective therapy Medicare benefit.17 The investigators were meticulous in their study design and approach and determined that the model shows a cumulative 5-year savings of nearly $1.5 billion. In 2023 health care dollars, this amount would double to $3 billion. Finally, Upadya, et al. compared the home and inpatient infusion cost of inotropic infusion therapy for patients waiting for cardiac transplantation and concluded that home infusion realized an average savings of $71,300 to $120,500 per patient when compared to inpatient infusion therapy.18

Table 1: Literature on Home/Outpatient and Inpatient Infusion Cost Comparision

First Author

Year

Therapy & Study Type

Site Comparison

Results

Chamberlain TM13

1988

Anti-infective retrospective chart and billing review

Inpatient vs Home infusion

Home infusion mean total cost savings per patient = $40,460

Dalovisio14

2000

Anti-infective retrospective chart review of home infusion pts vs theoretical cost of Inpatient

Inpatient vs Home infusion

Home Infusion mean cost per day = $122

Stewart A15

2017

Enzyme replacement retrospective chart review

Inpatient vs Home infusion

There was a significant difference (p≤.0001) in cost between inpatient and home infusion. Home infusion mean cost per day = $225.10, hospital mean cost per day = $586.50.

Ruh CA16

2015

Anti-infective retrospective chart review

Inpatient vs Rehab care vs Home infusion

Mean total cost savings for home infusion patients was $81,559 when compared to inpatient cost.

Tice A17

1998

Anti-infective cost model to determine a Medicare 5-year cost savings if home infusion coverage was implemented

The model shows cumulative 5-year savings of nearly $1.5 billion.

Upadya S18

2004

Inotrope comparative cost study (patients awaiting transplantation)

Inpatient vs Home infusion

Outpatient strategy saved a total of $71,300 to $120,500 per patient

Study Limitations

The article with the most robust methodology and analytical precision was conducted by Tice, et al. and involved a model that showed a 5-year Medicare savings of $3 billion in today’s dollars with the implementation of a home infusion anti-infective therapy Medicare benefit. Although the other studies demonstrate cost savings when the home is the SOC for infusion therapy, the ability to extrapolate the savings to the wide range of therapies provided today is compromised by mediocre research methodological quality. Additional economic assessments of the cost of infusion therapy are needed using more rigorous methodologies that include a broad range of perspectives to identify the real magnitude of the economic savings when the home is the SOC instead of the hospital, particularly for modern treatments that involve specialty drugs. Even so, all reviewed studies showed considerable cost savings when the home is the SOC.

Discussion

The objective of this literature review was to provide critical evaluation of the current evidence of the cost savings associated with home and outpatient infusion therapy when compared to inpatient therapy. The reviewed studies, although limited, demonstrate significant cost savings when the home is the SOC for infusion therapy, especially for IV anti-infective  treatment. This is significant as IV anti-infective therapies comprise nearly half of all treatments done at home today.1 The study by Stewart15, et al. provides evidence for savings associated with enzyme replacement, a therapy analogous to the growing number of specialty biologics being used today to manage chronic diseases.15 Numerous studies have examined the clinical benefits of home infusion as a driver for increased utilization, however few have analyzed the cost savings associated with shifting care to the home.

The growth in home infusion over the past decade is being impacted by commercial payors seeking to lower the overall costs associated with administering IV treatments. Broader provider experience and patient preferences for more convenient treatment options are also contributing factors. Despite evidence of cost savings and increased patient satisfaction, Medicare has not developed a home infusion benefit comparable to what is available in the U.S. private sector. In December 2016, the 21st Century Cures Act was enacted into law to establish a new Medicare home infusion benefit.19 However, the Centers for Medicare and Medicaid (CMS) limited reimbursement to services “only on days when a nurse is present in the patient’s home,” which is typically once a week, leaving significant gaps in coverage for essential pharmacy-related professional services that take place remotely.20 SOC choices for Medicare beneficiaries are generally limited to Part A and Part B facility-based settings. Patients who elect home infusion over other SOC settings (i.e., hospital, skilled facility, physician office, hospital outpatient department) must bear the financial burden of paying out of pocket for the costs of supplies and professional pharmacy services (IV drugs are often covered by Part D). This review suggests that Medicare could achieve as much as $3 billion dollars in savings by providing more comprehensive access to home infusion for beneficiaries.

Conclusions

The literature review provides evidence of consistent cost savings associated with home and outpatient infusion therapy when compared to the inpatient SOC for a range of infused drugs. The study with the most rigorous methodology was conducted by Tice, et al. and involved a model that showed a 5-year Medicare savings of $3 billion in today’s dollars with the implementation of a home infusion anti-infective therapy Medicare benefit.17

References

1. National Home Infusion Association (NHIF). Infusion Industry Trends 2020. Alexandria, Va. NHIA 2020.

2. Polinski JM, Kowal MK, Gagnon M, Brennan TA, Shrank WH. Home infusion: Safe, clinically effective, patient preferred, and cost saving. Healthc (Amst). 2017 Mar;5(1-2):68-80. doi: 10.1016/j.hjdsi.2016.04.004. Epub 2016 Apr 29. PMID: 28668202.

3. HMP Global Learning Network. Research Reports, Pegfilgrastim Home Redirection Outcomes: Effectiveness and Timing of Administration in Primary Prophylaxis of Chemotherapy-Induced Neutropenia. Available at: https://www.hmpgloballearningnetwork.com/site/jcp/research-reports/pegfilgrastim-home-redirection-outcomes-effectiveness-and-timing (Accessed 26 July 2023).

4. UnitedHealth Group. Administering Specialty Drugs Outside Hospitals Can Improve Care and Reduce Costs by $4 Billion Each Year. Available at: https://www.unitedhealthgroup.com/content/dam/UHG/PDF/2019/UHG-Administered-Specialty-Drugs.pdf (Accessed 26 July 2023).

5. Psaltikidis EM, Silva END, Bustorff-Silva JM, Moretti ML, Resende MR. Economic evaluation of outpatient parenteral antimicrobial therapy: a systematic review. Expert Rev Pharmacoecon Outcomes Res. 2017 Aug;17(4):355-375. doi: 10.1080/14737167.2017.1360767. Epub 2017 Aug 4. PMID: 28776441

6. Balinsky W, Nesbitt S. Cost-effectiveness of outpatient parenteral antibiotics: a review of the literature. Am J Med. 1989 Sep;87(3):301-5. doi: 10.1016/s0002-9343(89)80155-x. PMID: 2505615.

7. Perraudin C, Bourdin A, Vicino A, Kuntzer T, Bugnon O, Berger J. Home-based subcutaneous immunoglobulin for chronic inflammatory demyelinating polyneuropathy patients: A Swiss cost-minimization analysis. PLoS One. 2020 Nov 25;15(11):e0242630. doi: 10.1371/journal.pone.0242630. PMID: 33237959; PMCID: PMC7688145.

8. Yong C, Fisher DA, Sklar GE, Li SC. A cost analysis of Outpatient Parenteral Antibiotic Therapy (OPAT): an Asian perspective. Int J Antimicrob Agents. 2009 Jan;33(1):46-51. doi: 10.1016/j.ijantimicag.2008.07.016. Epub 2008 Sep 26. PMID: 18823759.

9. Remonnay R, Devaux Y, Chauvin F, Dubost E, Carrère MO. Economic evaluation of antineoplasic chemotherapy administered at home or in hospitals. Int J Technol Assess Health Care. 2002 Summer;18(3):508-19. PMID: 12391944.

10. Thornton J, Elliott RA, Tully MP, Dodd M, Webb AK. Clinical and economic choices in the treatment of respiratory infections in cystic fibrosis: comparing hospital and home care. J Cyst Fibros. 2005 Dec;4(4):239-47. doi: 10.1016/j.jcf.2005.08.003. Epub 2005 Oct 19. PMID: 16242385.

11. Marshall JK, Gadowsky SL, Childs A, Armstrong D. Economic analysis of home vs hospital-based parenteral nutrition in Ontario, Canada. JPEN J Parenter Enteral Nutr. 2005 Jul-Aug;29(4):266-9. doi: 10.1177/0148607105029004266. PMID: 15961683.

12. Tsai TC, Doherty GM. Site of Care Optimization Through Home Hospital for Surgical Patients: The Next Frontier for Health Care Value and Population Health Management. Ann Surg. 2022 Jan 1;275(1):e278-e279. doi: 10.1097/SLA.0000000000005172. PMID: 34387212.

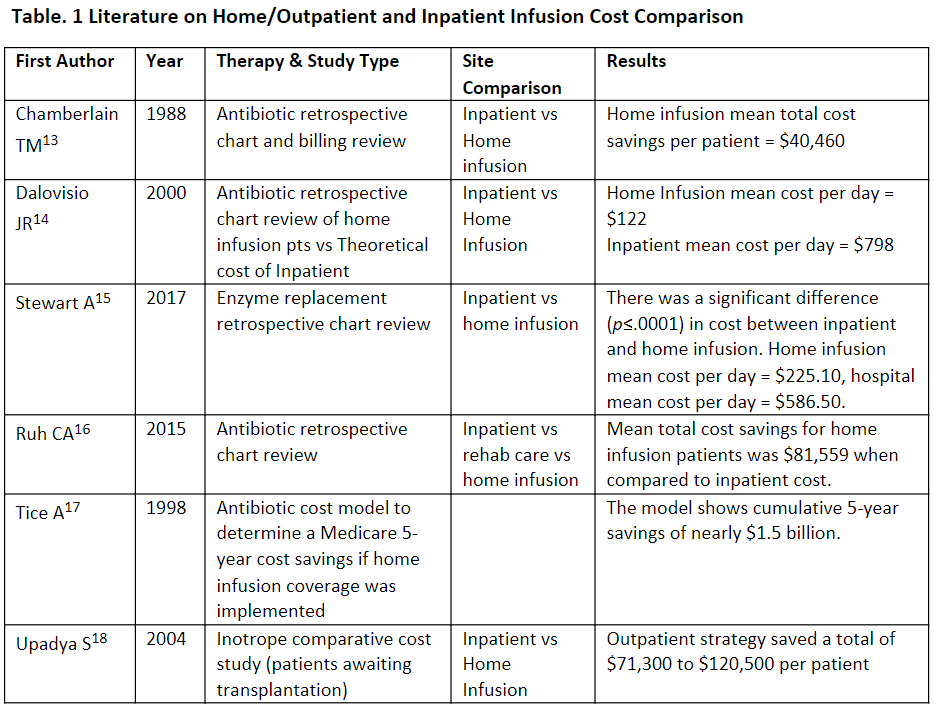
13. Chamberlain TM, Lehman ME, Groh MJ, Munroe WP, Reinders TP. Cost analysis of a home intravenous antibiotic program. Am J Hosp Pharm. 1988 Nov;45(11):2341-5. PMID: 3228090.

14. Dalovisio JR, Juneau J, Baumgarten K, Kateiva J. Financial impact of a home intravenous antibiotic program on a medicare managed care program. Clin Infect Dis. 2000 Apr;30(4):639-42. doi: 10.1086/313755. Epub 2000 Apr 4. PMID: 10770722.

15. Stewart, A., & Hao, L. (2017). Comparison Of Costs Between Hospital And Home Infusions In Patients Treated With Laronidase. Value in Health, 20(9), A496.

16. Ruh CA, Parameswaran GI, Wojciechowski AL, Mergenhagen KA. Outcomes and Pharmacoeconomic Analysis of a Home Intravenous Antibiotic Infusion Program in Veterans. Clin Ther. 2015 Nov 1;37(11):2527-35. doi: 10.1016/j.clinthera.2015.09.009. Epub 2015 Oct 21. PMID: 26471204.

17. Tice AD, Poretz D, Cook F, Zinner D, Strauss MJ. Medicare coverage of outpatient ambulatory intravenous antibiotic therapy: a program that pays for itself. Clin Infect Dis. 1998 Dec;27(6):1415-21. doi: 10.1086/515028. PMID: 9868653.

18. Upadya SP, Sedrakyan A, Saldarriaga C, Nystrom K, Bozzo J, Lee FA, Katz SD. Comparative costs of home positive inotropic infusion versus in-hospital care in patients awaiting cardiac transplantation. J Card Fail. 2004 Oct;10(5):384-9. doi: 10.1016/j.cardfail.2004.02.004. PMID: 15470648.

19. Home infusion therapy services. Centers for Medicare & Medicaid Services. Updated January 19, 2022. Accessed July 4, 2023. https://www.cms.gov/Medicare/Medicare-Fee-for-Service-Payment/Home-Infusion-Therapy/Overview#:~:text=Home%20infusion%20therapy%20 involves%20the,example%2C%20tubing%20and%20catheters

20. NHIA denounces CMS proposed home infusion rule. News release. National Home Infusion Association. July 12, 2019. Accessed July 4, 2023. https://nhia.org/documents/CMS_proposed_rule_press_release.pdf

Author Information: Danell J. Haines, PhD received her doctorate from The Ohio State University and currently serves as a research consultant. At Ohio State she served as a Research Scientist for the Department of Family Medicine and Director for the National Research Institute for College Recreational Sports and Wellness.

Disclosures: This study was funded by the National Home Infusion Association. Dr. Haines provides independent research services to the National Home Infusion Foundation, a not-for-profit subsidiary of NHIA.