
Menu
Introduction: Approximately 15% of the U.S. population lives in rural areas. It is recognized that rural Americans have fewer health care opportunities when compared to metropolitan residents. One area of health care is home infusion with approximately 1,000 providers in the U.S. What is not understood is the availability of home infusion to rural patients. This study aimed to determine the annual percentage of home infusion patients living and receiving home infusion services in rural areas.
Methodology: This retrospective, multi-center study analyzed patient rural/non-rural status data collected from home infusion providers who utilize the CPR+® and CareTend® platforms for electronic health records. Patients were classified as rural if their zip code fell within the rural designation defined by the Centers for Medicare and Medicaid Services (CMS) DMEPOS Competitive Bidding Program. The analyzed data was from 2018, 2019, and 2020, and included calculating the total number of unique patients and those who were considered rural. From this information, the overall percentage of rural patients was determined. The rural percentage for each provider was coded into 1 of 4 categories (0-10%, 11-25%, 26-49%, and 50% or greater). The frequency and percentage of providers who fell into each category was calculated so that trends could be observed, and data summaries more easily determined.
Results: Rural/Non-rural data from 200 individual pharmacy locations was submitted for analysis. For the 3-year period, there were 545,280 unique home infusion patients of which 71,278 were considered rural. Overall, 13.1% of patients served by these home infusion providers lived in rural areas. The number and percentage of rural patients served increased over the 3-year analysis period.
Discussion: This is the first study to quantify the use of home infusion in rural populations. It is known that patients in rural areas experience challenges with health care, including increased travel time for physician visits and chronic disease management. Unquestionably, home infusion alleviates patient travel barriers. The study data shows that most home infusion providers are serving patients living in rural areas and the percentage of rural patients has increased from 2018 to 2020.
Conclusion: Home infusion use in rural areas is well-established. Home infusion may offer advanced, infusion-based treatments more accessible to patients with limited health care options due to lack of proximity to urban centers.
Keywords: Rural population, infusion, health care disparity, access to care, travel barrier
This retrospective, multi-center study analyzed data from home infusion providers who utilize the CPR+® and CareTend® (WellSky®) prescription management platform and electronic health record (EHR) software products. Participation in the study was voluntary and open to all eligible client companies using the applicable software. Participation in the study was promoted to members of NHIA through postings on the association website and in e-newsletters. Data collection occurred from July 1, 2021, to August 31, 2021.
For this study, patients were classified as rural if their zip code fell within the rural designation defined by the Centers for Medicare and Medicaid Services (CMS) DMEPOS Competitive Bidding Program. Within the DMEPOS program, there are 4 categories of zip codes: Competitive Bidding Area, Non-Rural, Rural, and Non-contiguous. While this is a more constricted characterization of rural compared to the U.S. Census Bureau definition, it provides a reasonable method for classifying infusion patient data.
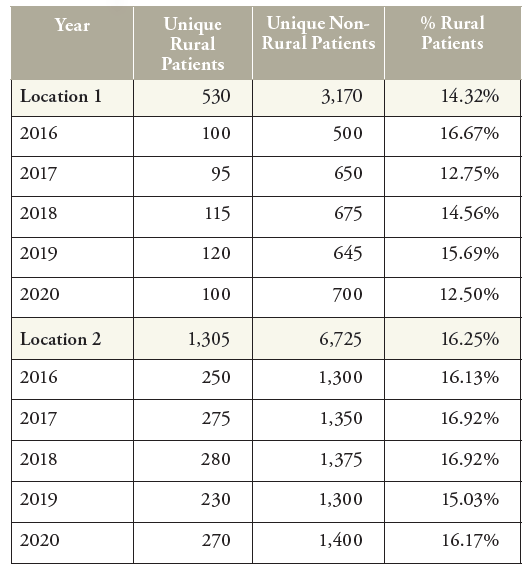
Participating providers were asked to generate a de-identified report that categorizes each unique patient as non-rural or rural. The report also filtered infused drug therapies based on the order type and excluded non-IV drug therapies (i.e., enteral, oral). Data was grouped by the number of unique patients who received an infusion therapy in each calendar year based on whether their zip code falls into a rural area as defined (see Figure 1 for a sample report). Sites were instructed to submit data for a 5-year look-back period (2016 to 2020). The data was exported to Excel® files and submitted to NHIA either by email or through an anonymous data portal. The data was aggregated to a single Excel® file and imported to IBM SPSS® (Statistical Product and Service Solutions) for analysis.
FIGURE 1 | Sample Provider Report
Rural/Non-rural data was submitted for analysis from 200 individual pharmacy locations and represents 20.5% of all home infusion provider locations. The home infusion software implementation not being fully deployed for the full calendar year may have resulted in under-reporting in 2016 and 2017 from some providers, therefore, to minimize the risk of incomplete submissions, the data for 2016 and 2017 was removed from the analysis. Data submitted for 2018, 2019, and 2020 was used for the analysis.
For the 3-year period, there were 545,280 unique home infusion patients of which 71,278 were considered rural. Overall, 13.1% of patients served by these home infusion providers lived in rural areas as defined by Centers for Medicare and Medicaid Services (CMS) for the DMEPOS competitive bidding program. As noted in Table 1 and Figure 2, the number and percentage of rural patients served increased slightly over the 3-year analysis period.
FIGURE 2 | Rural and Non-Rural Patients
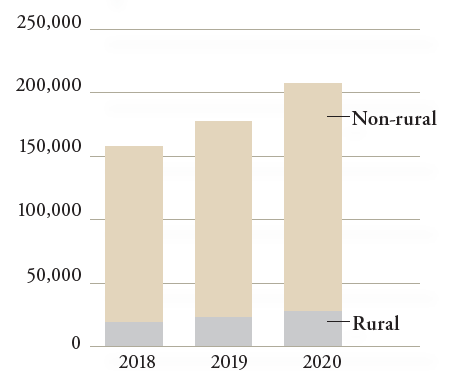
TABLE 1 | Comparison of Rural and Non-Rural Patients by Year
Year |
N (sites) |
Rural Patients |
% |
Non-Rural Patients |
% |
Total |
|---|---|---|---|---|---|---|
|
2018
|
191
|
20,177
|
12.8%
|
137,791
|
87.2%
|
157,968
|
|
2019
|
191
|
23,219
|
13.0%
|
155,646
|
87.0%
|
178,865
|
|
2020
|
183
|
27,882
|
13.4%
|
180,565
|
86.6%
|
208,447
|
|
Total
|
|
71,278
|
13.1%
|
474,002
|
86.9%
|
545,280
|
TABLE 2 | Rural Percent Category
Frequency |
Percent |
|
|---|---|---|
|
0-10% Rural Patients
|
88
|
44.0
|
|
11-25% Rural Patients
|
61
|
30.5
|
|
26-49% Rural Patients
|
39
|
19.5
|
|
50% of Greater Rural Patients
|
12
|
6.0
|
|
Total
|
200
|
100
|
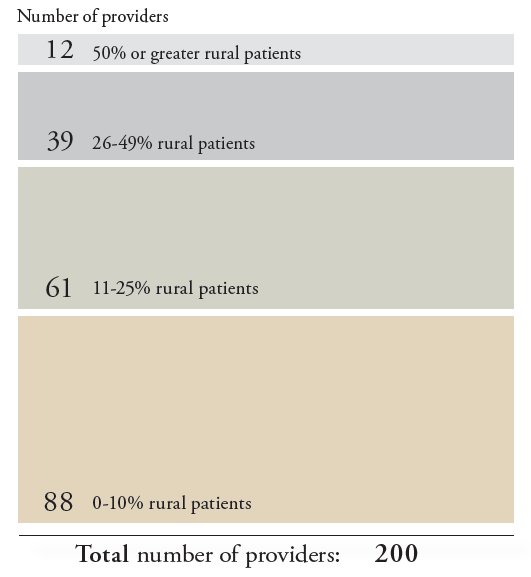
Further analysis revealed wide variation in the rural populations served by certain home infusion locations. It is surmised that providers with high percentages of rural patients may have been located nearer to the edge of, or outside a metropolitan area. Grouping the locations by their overall percentage of rural patients allows for closer examination of home infusion use in rural areas. Table 2 and Figure 3 illustrate that 25.5% of home infusion locations had rural populations of 26% or more, while 12 locations (6%) had rural populations greater than 50% of all patients served over the 3-year period. When the individual provider location’s rural percentage is compared, the median (50th percentile) is 11.60% for 2018-2020. The median was slightly lower than the mean for each study year due to 12 providers who reported no rural patients. The medians for each year were: 2018 = 10.58%, 2019 = 11.80%, and 2020 = 12.26%.
FIGURE 3 | Location Groupings by Overall Percentage of Rural Patients
The typical home infusion provider census is approximately 13.1% rural and 86.9% non-rural. There is broad variation among providers. Home infusion use in rural areas is well-established. It may offer advanced, infusion-based treatments that are more accessible to patients with limited health care options due to lack of proximity to urban centers.
WellSky is a member of the National Home Infusion Association Future of Infusion Advisory Council. This work for this study was independently funded by WellSky and NHIA.
Commentary: When reviewing a manuscript submitted by one of Infusion Journal’s editors or staff, the author/editor is deliberately excluded from all aspects of the review process. The Editor-in-Chief or alternate editor is responsible for handling the peer review process independently of the author/editor. The author/editor is not aware of the choice of peer reviewers, and the author/editor is not present when discussing the manuscript at editorial meetings.
1. Centers for Disease Control and Prevention (internet). Rural Health (cited 2021 Dec 27). Available from: https://www.cdc. gov/ruralhealth/about.html
2. U.S. Census Bureau. Defining “Rural” Areas (cited 2021 Dec 27). Available from: https://www.census.gov/content/dam/Census/library/publications/2019/acs/ACS_rural_ handbook_2019_ch01.pdf
3. National Rural Health Association. About rural healthcare
(cited 2021 Dec 27). Available from: https://www.ruralhealth.us/about-nrha/about-rural-health-care
4. National Home Infusion Foundation (2020). Infusion Industry Trends 2020. Published by the National Home Infusion Association.
5. Centers for Medicare & Medicaid Services. Adjustments to Fee Schedule Amounts for Certain DMEPOS Using Information from the Competitive Bidding Program (cited 2021 Dec 27). Available from: https://www.cms.gov/newsroom/fact-sheets/adjustments-fee-schedule-amounts-certain-dmepos-using-information-competitive-bidding-program
| Cookie | Duration | Description |
|---|---|---|
| cookielawinfo-checbox-analytics | 11 months | This cookie is set by GDPR Cookie Consent plugin. The cookie is used to store the user consent for the cookies in the category "Analytics". |
| cookielawinfo-checbox-functional | 11 months | The cookie is set by GDPR cookie consent to record the user consent for the cookies in the category "Functional". |
| cookielawinfo-checbox-others | 11 months | This cookie is set by GDPR Cookie Consent plugin. The cookie is used to store the user consent for the cookies in the category "Other. |
| cookielawinfo-checkbox-necessary | 11 months | This cookie is set by GDPR Cookie Consent plugin. The cookies is used to store the user consent for the cookies in the category "Necessary". |
| cookielawinfo-checkbox-performance | 11 months | This cookie is set by GDPR Cookie Consent plugin. The cookie is used to store the user consent for the cookies in the category "Performance". |
| viewed_cookie_policy | 11 months | The cookie is set by the GDPR Cookie Consent plugin and is used to store whether or not user has consented to the use of cookies. It does not store any personal data. |